Mastering the JavaScript Console Like a Pro (2024)
Unlock the full power of the JavaScript console—from grouping and timing to visualizing data—to debug smarter and build faster in 2024.
It’s 2024, and you’re still using console.log for debugging? While console.log is reliable, JavaScript's console object now offers many new features that make debugging more efficient and enjoyable. Modern frontend development demands better tools for quickly identifying and solving issues. The enhanced console includes features like grouped logging, timers, table displays, and stack traces, which improve log readability and organization. Let's explore the most commonly used console interfaces and see how they can optimize our workflow and boost productivity. Dive in to learn how these tools can transform your development process.
Frequently Used Methods
1. Commonly Used Debugging Interfaces::console.log()、console.info()、console.warn()、console.error()、console.debug()
These are the most commonly used debugging output interfaces. console.log() outputs general information, console.info() provides informational messages, console.warn() issues warnings, console.error() logs error messages, and console.debug() is used for debug-specific messages. Together, they help categorize and differentiate the types of messages logged to the console, making it easier to track and troubleshoot issues in your code.
console.log('General message');
console.info('Informational message');
console.warn('Warning message');
console.error('Error message');
console.debug('Debug message'); 
2. Grouping Console Messages: console.group()、console.groupCollapsed()、console.groupEnd()
These interfaces are used to group related log messages together, making it easier to manage and navigate through complex logs. console.group() creates a new inline group, console.groupCollapsed() creates a new collapsed group (which can be expanded by the user), and console.groupEnd() ends the current group.
Usage Scenario
Imagine you have a function that processes multiple tasks, and you want to log the start and end of each task, as well as some details in between. Using these grouping methods, you can clearly separate and organize your logs.
Example
console.group('Task 1');
console.log('Task 1 started');
// Details about Task 1
console.log('Processing data for Task 1');
console.groupEnd();

console.groupCollapsed('Task 2');
console.log('Task 2 started');
// Details about Task 2
console.log('Processing data for Task 2');
console.groupEnd();
In this example, the log for “Task 1” is expanded by default, while the log for “Task 2” starts collapsed. This makes it easier to manage and view logs, especially when dealing with multiple tasks or steps in a process.
3. Tabular Data Display:console.table()
The console.table() method is used to display tabular data in a console in a visually appealing and easy-to-read format. This method is particularly useful when you need to log arrays of objects or other structured data, as it formats the output as a table with rows and columns.
Usage Scenario
When you have an array of objects and want to quickly inspect the properties of each object in a clear and organized manner, console.table() provides a perfect solution. It’s ideal for logging data sets, like user information or inventory lists, where each item has multiple attributes.
Example
const users = [
  { name: 'Alice', age: 25, city: 'New York' },
  { name: 'Bob', age: 30, city: 'San Francisco' },
  { name: 'Charlie', age: 35, city: 'Chicago' }
];

console.table(users);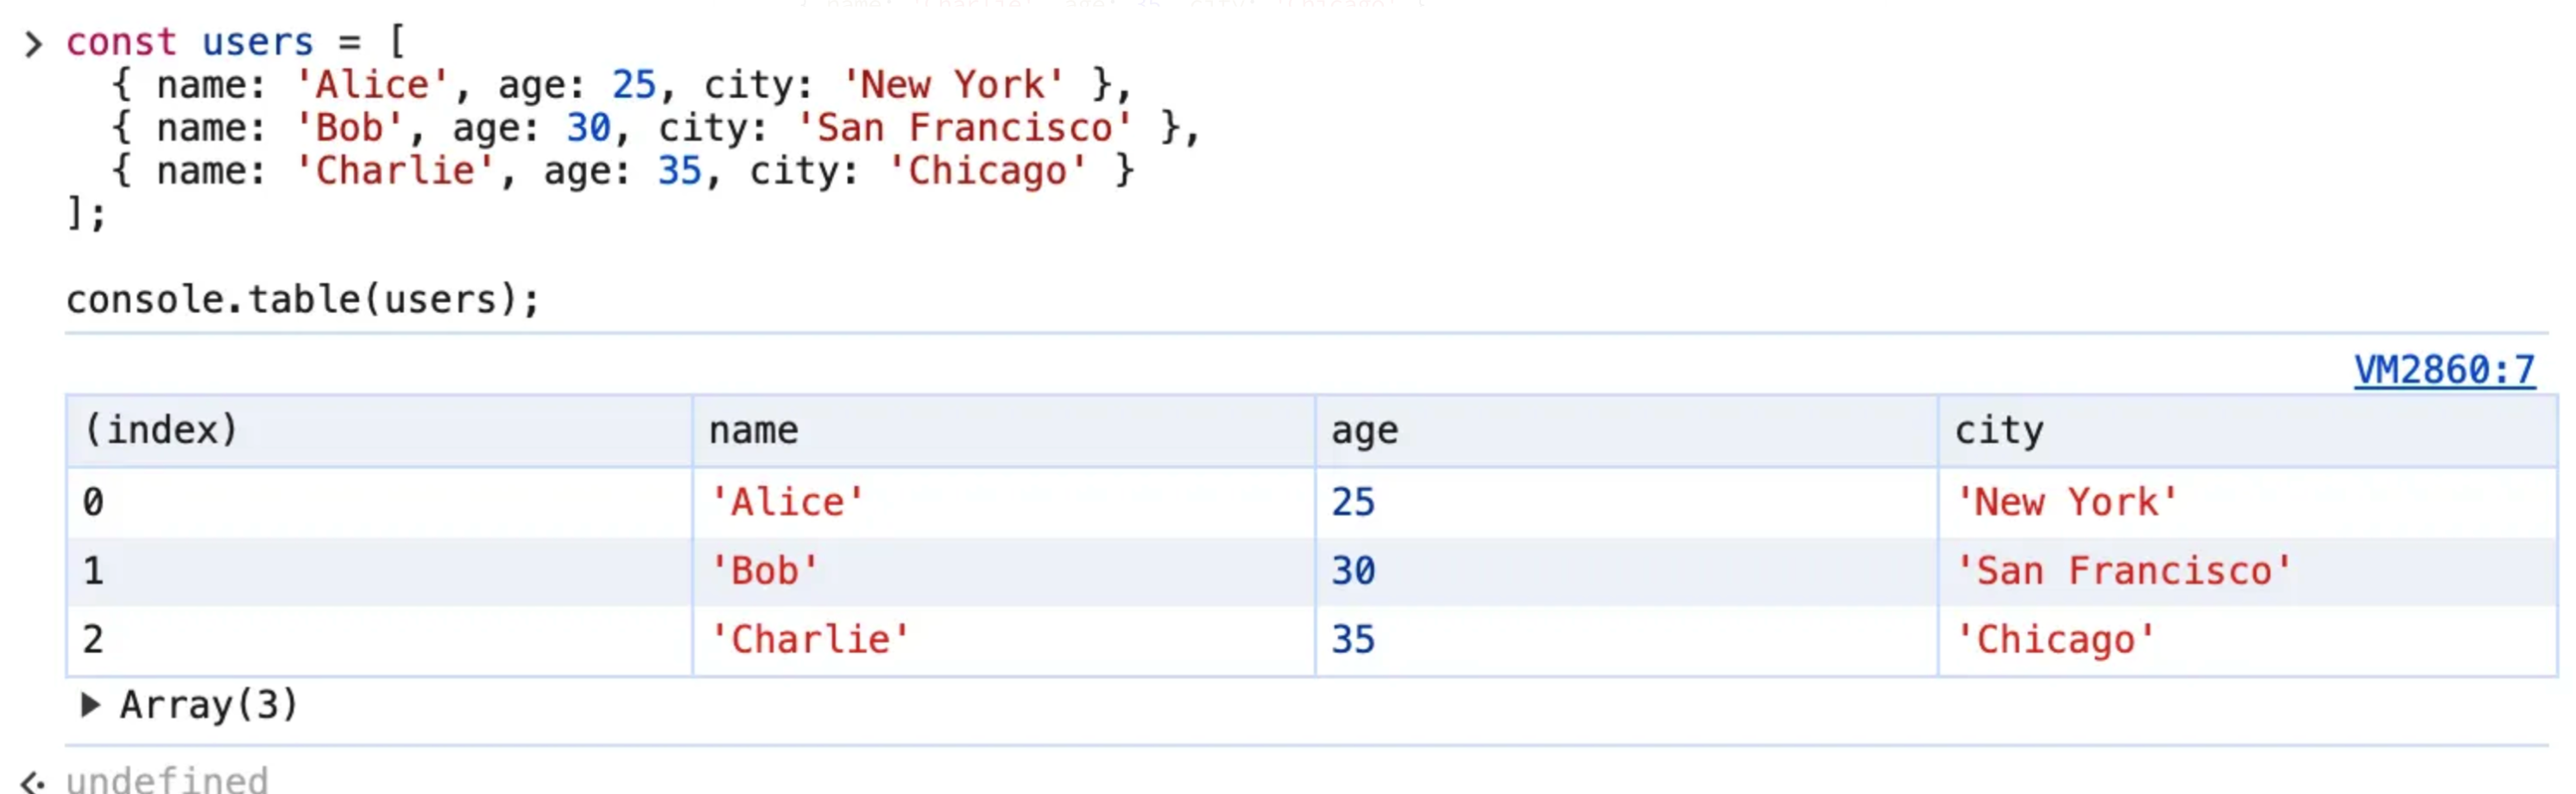
In this example, console.table() displays the users array in a table format, making it easy to see each user's name, age, and city at a glance. This enhances the readability and accessibility of the logged data, allowing for quicker inspection and analysis.
Moderately Used Methods
- Performance Timing:
console.time(),console.timeEnd(),console.timeLog()
These methods are used to measure the time taken by a block of code to execute. console.time() starts a timer with a given label, console.timeEnd() stops the timer and logs the elapsed time, and console.timeLog() logs the current elapsed time without stopping the timer.
Usage Scenario
When you need to profile the performance of specific code sections, such as functions or loops, these methods help you determine how long a particular piece of code takes to execute, allowing you to identify performance bottlenecks and optimize your code.
Example示例
console.time('Data Processing');

// Simulate a data processing task with increased complexity and delay
for (let i = 0; i < 10000000; i++) {
  let temp = Math.sqrt(i) * Math.sin(i) * Math.log(i + 1);
}

// Introduce a delay
let start = Date.now();
while (Date.now() - start < 2000) {
  // wait for 500ms
}

console.timeLog('Data Processing', 'Halfway through 1');

// Introduce a delay
start = Date.now();
while (Date.now() - start < 1000) {
  // wait for 500ms
}

console.timeLog('Data Processing', 'Halfway through 2');

// Simulate another part of the data processing task with increased complexity and delay
for (let i = 0; i < 10000000; i++) {
  let temp = Math.sqrt(i) * Math.sin(i) * Math.log(i + 1) * Math.cos(i);
}

// Introduce a delay
start = Date.now();
while (Date.now() - start < 1500) {
  // wait for 500ms
}

console.timeEnd('Data Processing');
In this example, the console.time() method starts a timer labeled "Data Processing". After the first loop, console.timeLog() logs the elapsed time so far without stopping the timer. After the second loop, console.timeEnd() stops the timer and logs the total elapsed time. This helps you understand how long different parts of your code take to execute, providing insights into performance optimization.
2. Conditional Logging: console.assert()
The console.assert() method is used to log a message only if a specified condition is false. This is particularly useful for debugging conditions that you expect to be true during execution. If the assertion fails (i.e., the condition is false), an error message is logged to the console. If the assertion passes (i.e., the condition is true), nothing happens.
Usage Scenario
When you want to ensure certain conditions hold true in your code and want to log errors if those conditions are violated. This can help catch and debug logical errors or unexpected states without interrupting the flow of your application.
Example
const age = 15;

// Check if age is at least 18
console.assert(age < 18, 'Age is less than 18: ', age);

// This assertion will fail and log an error message because age is not greater than or equal to 18
console.assert(age >= 18, 'Age is less than 18: ', age);
In this example, console.assert() checks whether the variable age is at least 18. Since age is 15, which is less than 18, the assertion fails, and the message "Age is less than 18: 15" is logged to the console. This helps you quickly identify and address issues where certain conditions are not met.
3. Counting Executions: console.count(),console.countReset()
The console.count() and console.countReset() methods are used to keep track of the number of times a particular piece of code is executed. console.count() increments and logs a counter each time it is called with a given label. console.countReset() resets the counter for a specified label.
Usage Scenario
When you want to track how many times a specific block of code runs, such as within loops, function calls, or event handlers. This can help identify performance bottlenecks, unexpected behavior, or verify that certain code paths are being executed as expected.
Example
function processItem(item) {
  console.count('Process Item Count');
  // Simulate item processing
  let result = item * 2;
  return result;
}

const items = [1, 2, 3, 4, 5];
items.forEach(item => processItem(item));

// Reset the counter
console.countReset('Process Item Count');

// Further processing
items.forEach(item => processItem(item));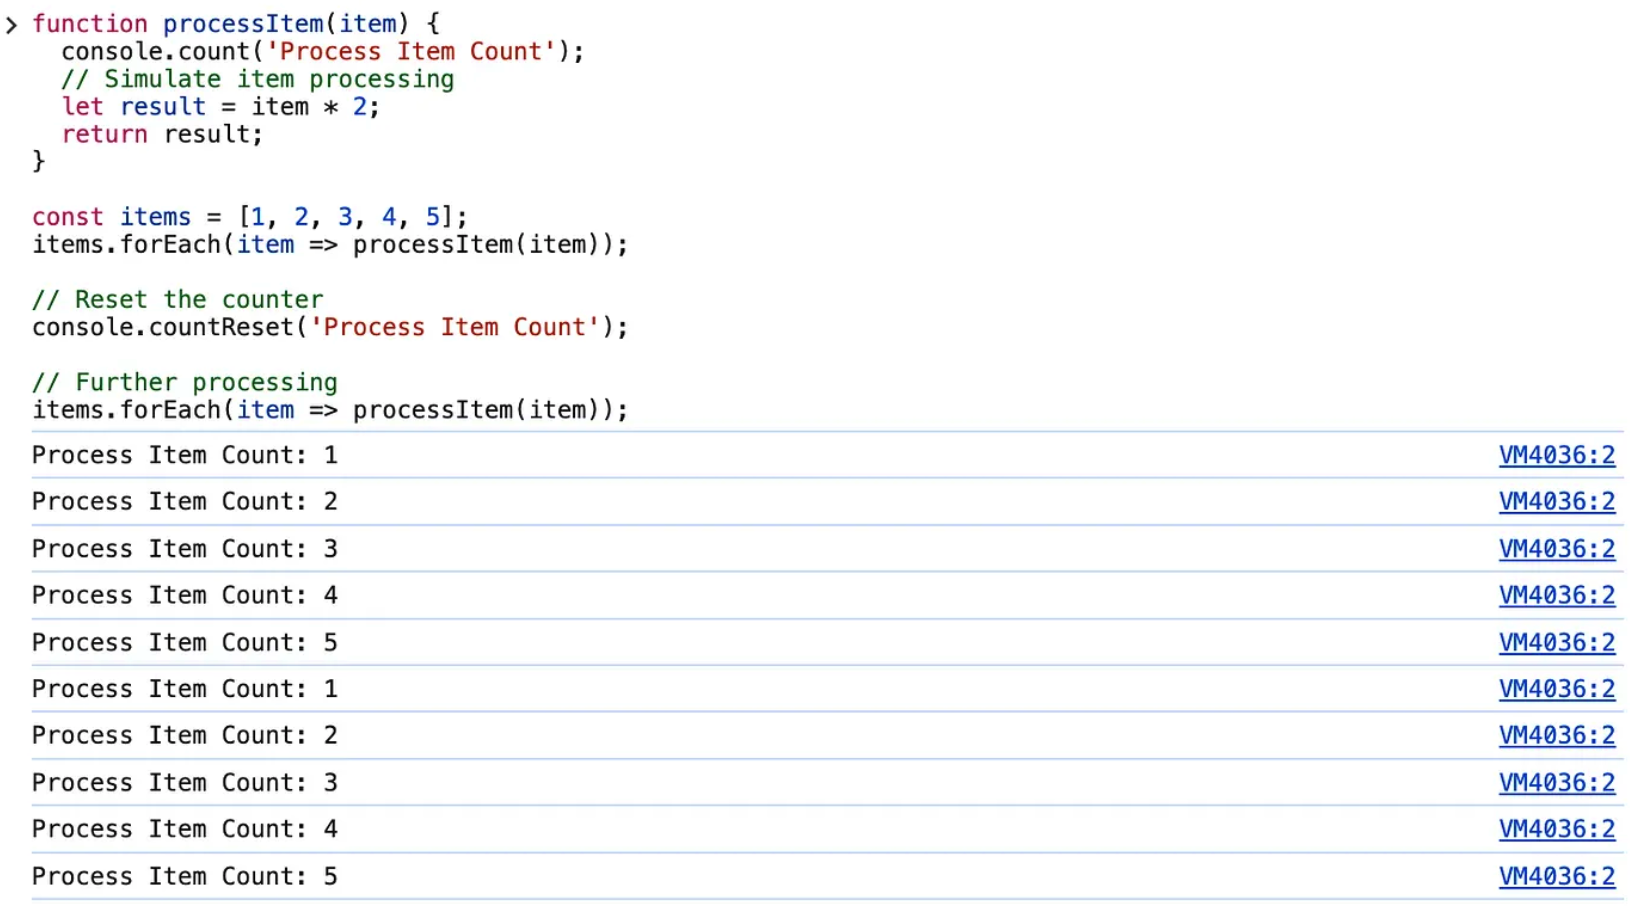
In this example, console.count('Process Item Count') logs the number of times the processItem function is called. The counter is incremented each time the function is invoked. After processing all items once, console.countReset('Process Item Count') resets the counter, and the counter starts again from zero during the subsequent processing. This helps you track the execution frequency of specific code blocks, ensuring they run as expected.
Less Frequently Used Methods
1. Clearing the Console: console.clear()
The console.clear() method is used to clear the console, removing all previously logged messages. This is useful for keeping the console clean and focused, especially when dealing with a lot of output.
Usage Scenario
When you want to clear out old log messages to reduce clutter and make it easier to focus on new logs. This can be particularly helpful during long development sessions or when debugging repetitive tasks that generate a lot of log output.
Example
console.log('This is an initial log message.');

// Clear the console
console.clear();

console.log('The console has been cleared.');
In this example, console.log('This is an initial log message.') outputs a message to the console. The console.clear() method then clears the console, removing the initial log message. Finally, console.log('The console has been cleared.') logs a new message, indicating that the console has been cleared. This helps maintain a clean and organized console, making it easier to see relevant log messages.
2. Inspecting Objects: console.dir(),console.dirxml()
The console.dir() and console.dirxml() methods provide more detailed and interactive ways to inspect JavaScript objects and XML/HTML elements in the console.
2.1 console.dir()
Use Case
Display an interactive list of the properties of a JavaScript object. This method outputs a hierarchical view of all properties, making it easier to explore complex objects.
Example
const person = {
  name: 'Alice',
  age: 30,
  address: {
    city: 'Wonderland',
    postalCode: '12345'
  }
};

console.dir(person);
In this example, console.dir(person) displays the person object in an interactive format, allowing you to expand and explore its properties and nested objects.
2.2 console.dirxml()
Use Case
Display an XML/HTML element in an XML-like tree format. This method is useful for inspecting the structure of DOM elements.
Example
const element = document.body;
console.dirxml(element);
In this example, console.dirxml(document.body) displays the body element of the current document as an expandable tree, making it easy to inspect its child elements and attributes.
Summary
- console.dir(): Use this method to get a detailed view of JavaScript objects, especially when dealing with nested structures.
- console.dirxml(): Use this method to inspect DOM elements in a tree-like format, which is particularly useful for debugging HTML structures.
These methods enhance your ability to explore and understand complex objects and DOM elements directly from the console, providing a more interactive and informative debugging experience.
3. Stack Tracing: console.trace()
The console.trace() method logs a stack trace from the point where it is called, showing the sequence of function calls that led to that point in the code. This is particularly useful for debugging and understanding the flow of execution in your program.
Usage Scenario
When you need to trace the execution path that led to a particular function or line of code, console.trace() helps you identify where and how functions are being called. This is especially valuable in complex applications with deep call stacks or when trying to diagnose unexpected behavior.
示例
function firstFunction() {
  secondFunction();
}

function secondFunction() {
  thirdFunction();
}

function thirdFunction() {
  console.trace('Tracking the call stack');
}

firstFunction();
In this example,console.trace('Tracking the call stack') is called within the thirdFunction. When firstFunction is called, it triggers secondFunction, which in turn triggers thirdFunction. The console.trace() method logs the sequence of calls that led to thirdFunction, providing a detailed stack trace like this:
Tracking the call stack
    at thirdFunction (yourfile.js:9)
    at secondFunction (yourfile.js:5)
    at firstFunction (yourfile.js:2)
    at yourfile.js:13
This output shows the exact path the code took to reach the console.trace() statement, helping you understand the flow and identify where issues might be occurring.
3. Non-Standard Methods
1. Performance Profiling: console.profile(),console.profileEnd()
The console.profile() and console.profileEnd() methods are used to start and stop the recording of a performance profile, which helps in analyzing the performance of your code. These profiles can be viewed in the performance or profiling tools of the browser's developer tools.
Usage Scenario
When you need to perform an in-depth analysis of your application’s performance, such as identifying slow functions or understanding the time taken by various parts of your code, these methods are invaluable. They provide a detailed breakdown of CPU usage, function calls, and execution time.
Example
console.profile('My Profile');

// Simulate a complex task
for (let i = 0; i < 1000000; i++) {
  let temp = Math.sqrt(i) * Math.sin(i) * Math.log(i + 1);
}

console.profileEnd('My Profile');
In this example, console.profile('My Profile') starts recording a performance profile labeled "My Profile". The loop simulates a complex task. When console.profileEnd('My Profile') is called, it stops the recording. You can then view the recorded profile in your browser's developer tools to analyze the performance of the code.
Viewing the Profile
- Open your browser’s developer tools (usually by pressing F12 or right-clicking and selecting “Inspect”).
- Go to the “Performance” or “Profiler” tab.
- You will see the profile labeled “My Profile” that you started and stopped in your code.
- Click on the profile to view detailed information about the execution, including function calls, CPU usage, and more.
By using console.profile() and console.profileEnd(), you can gain valuable insights into the performance characteristics of your application, helping you optimize and improve efficiency.
2. Adding Timestamps: console.timeStamp()
The console.timeStamp() method is used to create a timestamp in the browser's performance timeline. This can be useful for marking specific points in the code execution flow, making it easier to identify and correlate with other performance data during analysis.
Usage Scenario
When you need to mark specific events or moments in your application’s execution to understand their timing in relation to other events. This is particularly useful in performance analysis and debugging to pinpoint when certain operations occur.
Example
console.time('Total Operation Time');

// Simulate some initial operation
for (let i = 0; i < 500000; i++) {
  let temp = Math.sqrt(i) * Math.sin(i);
}

console.timeStamp('Midpoint Reached');

// Simulate some further operation
for (let i = 0; i < 500000; i++) {
  let temp = Math.sqrt(i) * Math.sin(i) * Math.log(i + 1);
}

console.timeEnd('Total Operation Time');
In this example, console.time('Total Operation Time') starts a timer for the total operation time. The first loop simulates some initial operation. console.timeStamp('Midpoint Reached') adds a timestamp labeled "Midpoint Reached" to mark the completion of the initial operation. The second loop simulates further operations, and console.timeEnd('Total Operation Time') stops the timer and logs the total time.
Viewing the Timestamp
- Open your browser’s developer tools (usually by pressing F12 or right-clicking and selecting “Inspect”).
- Go to the “Performance” or “Timeline” tab.
- Start recording a new performance profile.
- Run the code that includes the
console.timeStamp()call. - Stop the recording in the performance tab.
- You will see the “Midpoint Reached” timestamp in the timeline, providing a visual marker for when that specific point in the code was reached.
Using console.timeStamp() allows you to add precise markers in your performance profiles, making it easier to analyze the timing and sequence of events within your application.
JavaScript’s console object offers a diverse array of methods that go far beyond the basic console.log(). These methods provide powerful tools for debugging, performance profiling, and detailed inspection of your code. By leveraging these advanced console interfaces, you can significantly enhance your development workflow, making it easier to identify and resolve issues, optimize performance, and understand the behavior of your application.
From categorizing and grouping log messages with console.group(), console.groupCollapsed(), and console.groupEnd(), to displaying tabular data with console.table(), and measuring execution time with console.time(), console.timeEnd(), and console.timeLog(), each method serves a unique purpose. Conditional logging with console.assert(), execution counting with console.count() and console.countReset(), and clearing the console with console.clear() help maintain an organized and efficient debugging environment. Detailed object and XML/HTML inspection is facilitated by console.dir() and console.dirxml(), while console.trace() provides valuable stack trace information. Performance profiling and timestamping with console.profile(), console.profileEnd(), and console.timeStamp() allow for in-depth analysis and optimization.
By exploring and utilizing these methods, you can transform your approach to debugging and performance analysis, leading to more robust and efficient code. Embrace the full potential of the console object to take your frontend development skills to the next level.
Keep Reading
Writing about Finland, life, and code. The next post goes straight to your inbox, without the noise.
I put a lot of thought into this post—would love to hear your thoughts!