
How to Load Stunning Mapbox Maps in WeChat Mini Programs
Use web-view to embed Mapbox GL JS and unlock rich visual features like 3D, heatmaps, and clustering within your WeChat Mini Program.
Blog
Read articles in time order, or enter through story collections.
Use web-view to embed Mapbox GL JS and unlock rich visual features like 3D, heatmaps, and clustering within your WeChat Mini Program.
An engineer’s story of building a postcard exchange platform—connecting strangers around the world through stories, creativity, and serendipitous messages.
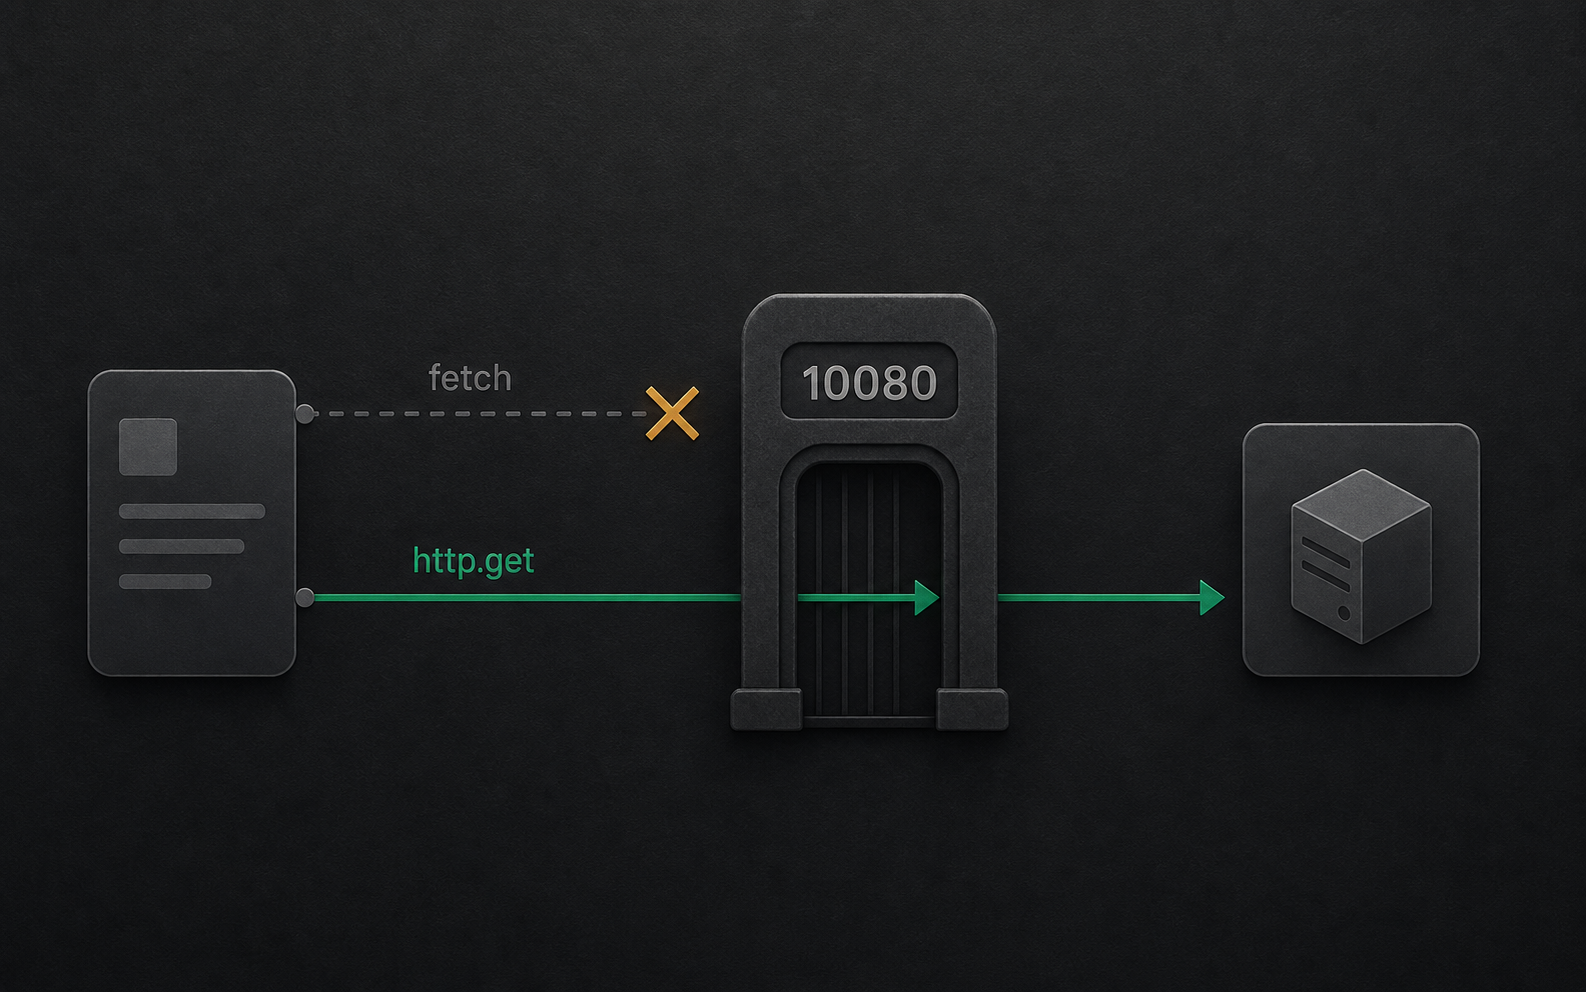
WeChat Mini Programs don't officially support third-party maps, but with a clever web-view workaround, this post demonstrates how to embed interactive Mapbox maps—covering enterprise requirements, domain verification, and postMessage communication.
Learn how to pad numbers with leading zeros using a simple one-liner in JavaScript, and watch out for edge cases with overly long numbers.
From manual deployment to full automation, this post walks through configuring Travis CI to run builds and deploy code to remote servers over SSH.
A hands-on guide by Mofei on maintaining high code quality using Travis CI, Tape, nyc, and codecov.io, complete with real-world Node.js examples.
A complete guide by Mofei on how to debug native Node.js C++ addons in VS Code using launch.json, breakpoints, and preLaunchTask settings.
Mofei reflects on his onboarding trip to Mapbox's US offices, highlighting open communication, inclusive culture, and quirky workplace details like gender-neutral bathrooms and office meme wars.
A retrospective of Mofei’s major 2017 projects—from data bus Marine to scaffolding tool Keeler and visualization system Visual—highlighting innovations in front-end architecture, developer experience, and urban IoT visualization.
mapv-Editor is a web-based geographic data editor built on the MapV engine, supporting multi-format data import, customizable base maps, and intuitive layer configuration with a near-native user experience.
This post explores the process of simulating a crossroad with zebra crossings using JavaScript Canvas, covering normalized coordinate processing, road sorting, intersection computation, and canvas transformation techniques.